A small preface
Understanding signaling pathways that are overexpressed in disease will ultimately lead to new therapeutic targets. As an example, 80% of breast cancers are Estrogen Recepetor (ER) positive, meaning that cancer cells grow in response to estrogen. To understand Estrogen signaling in detail, we normally stimulate the ER pathway with Estradiol and measure changes in RNA, protein, or metabolites at a single (or handful) of time points following perturbation. Often when we compare treatment to control-treated cells, we are faced with a huge Excel spreadsheet with thousands of features that have a signficant fold change (p-value less than 0.1).
Hover over rectangles to see top 5 most enriched pathways. Genes are considered differentially expression if their absolute log 2 fold changed is greater 1 and their adjusted p-value is less 0.1 relative to untreated samples using the DEseq2 model.In part, we think there are so many significant changes in protein or gene expression because the primary effect of Estrogen leads to amplifications that snowball over time. When we do profile the system, there are so many downstream effects that we have a hard time figuring out what the pathway is actually doing.
Think about turning on a car. When the key is turned, the crank turns the pistons which moves the cylinders firing the spark plugs and ultimately leading to combustion. I'm not a mechanic, but the key idea is that a set of operations is needed to turn the car on in the first place. If we just compare an OFF car to an ON car, we'd see a lot of features different between the two states and no idea how we go there.
With this analogy in mind, think of estogen signaling: 1) estrogen binds ER, 2) ER relocates from the cell membrane to the nucleus, 3) co-factors regulated ER activity, 4) ER binds DNA as a transcription factor, 5) ER turns on hundreds of genes that ultimately leads to cell growth. (By the way, there are quite a few other ways for estrogen to induce signaling pathways via GPCR and RTK receptors.)
So when we compare estogen signaling that is in the "ON" state relative the untreated "OFF" state, we are going to note a lot of differences. One way to understand how Estrogen signaling got going in the first place is to take snapshots of RNA over time as the pathway is stimulated. We could then track which genes turn on at specific time points. This (in principle) would be like watching the pistons move and then the spark plugs fire.
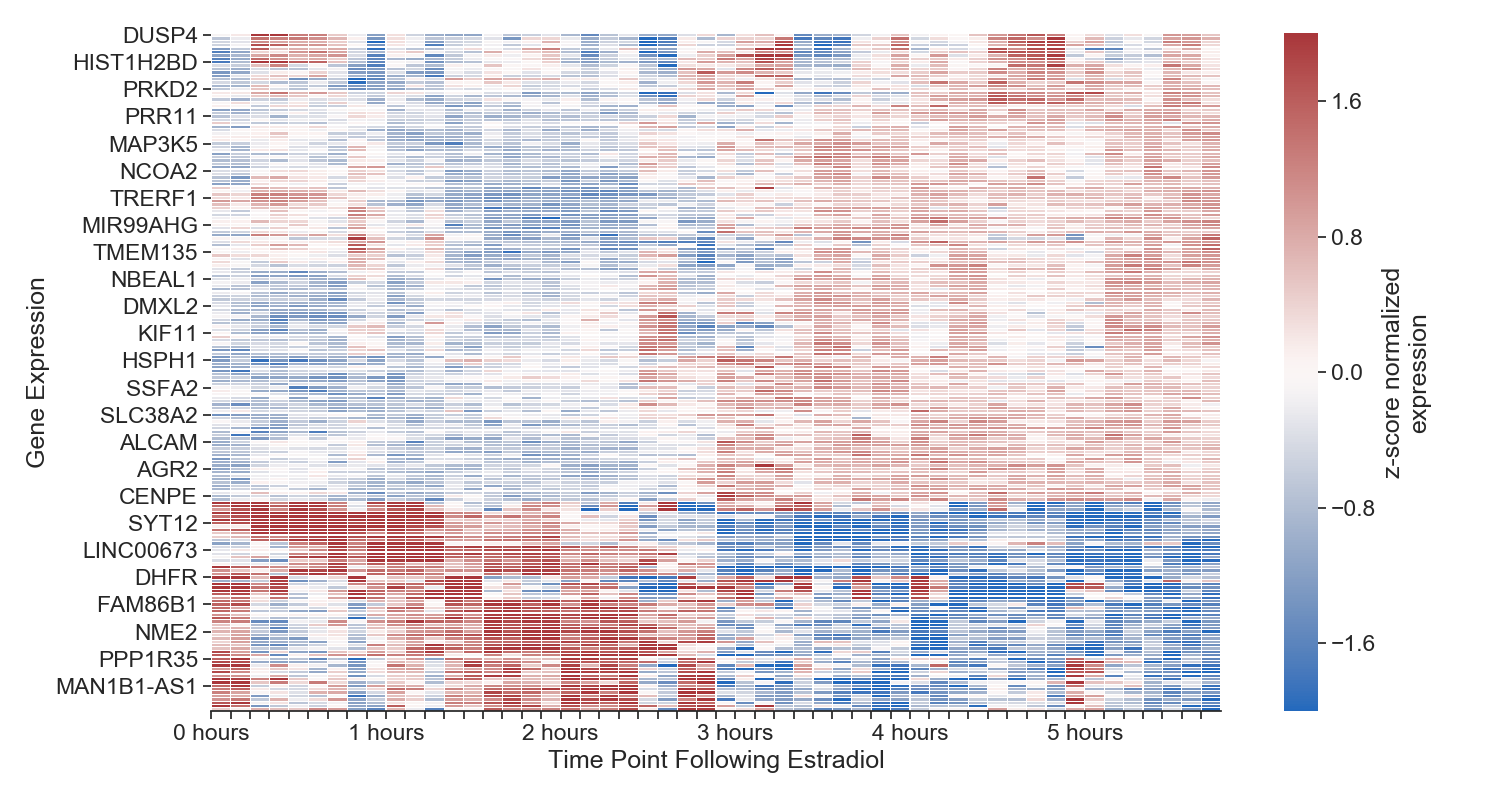 Each column represents a time point, each row represents a gene. We aren't displaying all genes in the genome, just the top 1000 most variable. The more red the cell, the more expressed that gene is at that time point. The more blue, the less expressed. All gene expression is normalized to itself
Some Initial Results
As mentioned earlier, we collected nascent RNA via a variant of the PRO-seq protocol every 15 minutes for 6 hours following Estradiol treatment in ER+ MCF7 cells (in duplicate for each time point). We noted that there was a very early increase in gene expression as early as 15 minutes and that the genes that were differentially expressed at 15 minutes (via DeSeq2 relative to untreated) were enriched for the estogren signaling pathway. There's no surprise here other than to appreciate that this signaling pathway can be stimulated quite quickly.
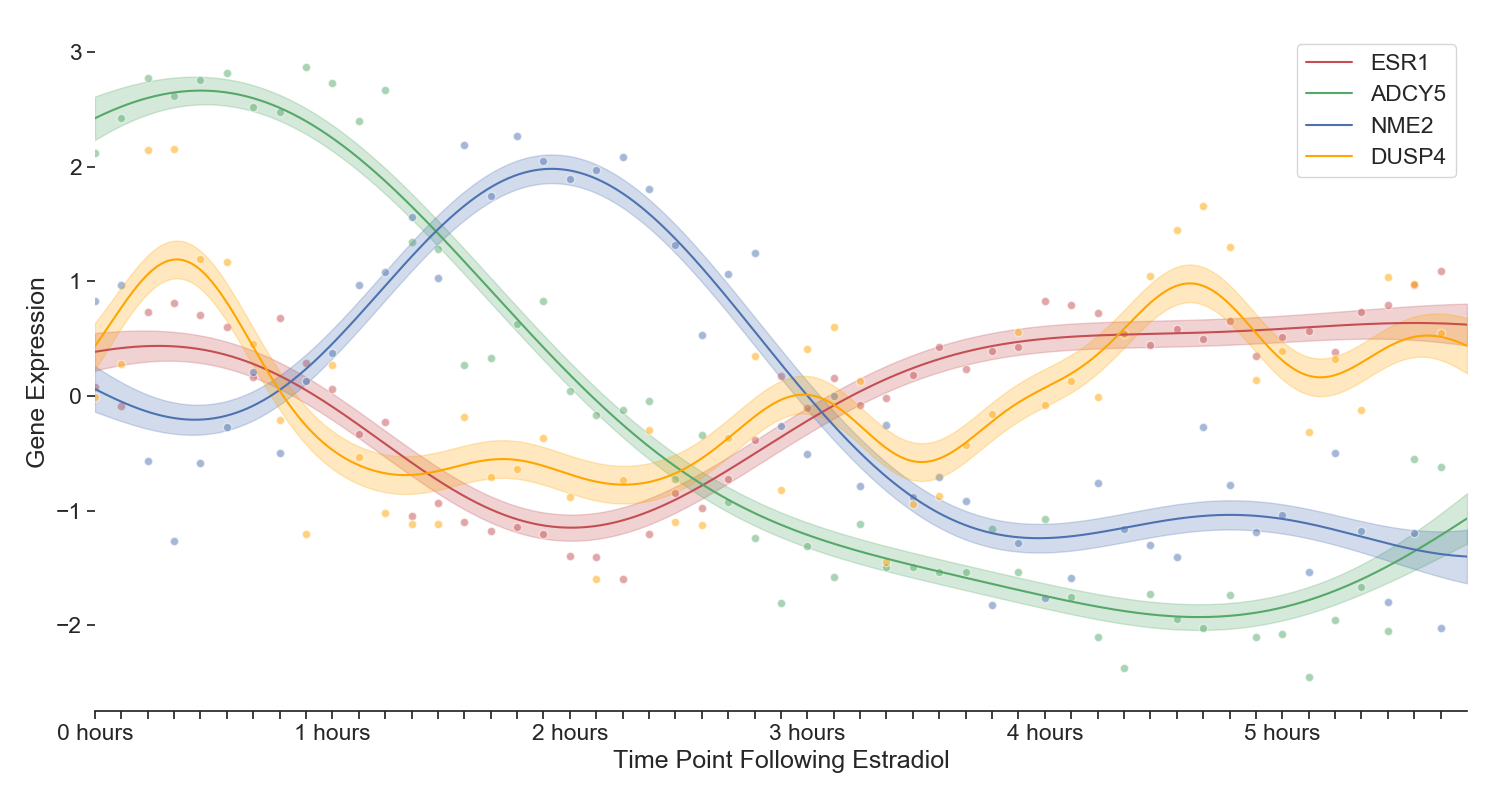 Four genes displaying interesting periodicity and transcriptional wave dynamics. Note that the interpolation is a Gaussian Process with radial basis function kernel
Following a roughly one hour time point of strong ER signaling, it appears that the system cools down (i.e. there appear to be fewer genes going up between 2-3 hours, but nothing major) and then by three hours we are noting a significant amount of repressed differential expression (as well as up-regulation of new genes). These repressed genes appear to actually be estrogen signaling genes. This oscillation in estrogen signaling has been noted here and here. The extent that this periodicity plays in later cell growth is not well understood.
Although there appears to be a generally quieting of gene expression between 1-2 hours, some genes are popping up. Specifically a cluster (see figure 2) defined by the gene NME2 where it peaks prominently at 2 hours. A little bit of background on the paralog NME1: NME1 associates with estrogen receptors in ER-positive breast cancers. The NME1 ER interaction was shown to facilitate interactions with estrogen response DNA elements, resulting in decreased expression of Bcl-2, cathepsin D, and cyclin D1. Take a look here for more information on the clear role NME2 plays in the ER pathway. This gene's paralog, NME2, was featured in the second wave of transcriptional activity.
Why don't we do more Time Series experiments?
I think there are three reasons:
- lots of time points are "expensive" to collect
- we lack an optimal method for taking "snapshots" of RNA
- if we did have time points, how would be actually analyze this data?
Let's start with the first point (expensive). Is that actually true anymore? A standard RNA-seq experiment (assuming 5M reads per sample) would cost somewhere around $100 a sample in sequencing. No doubt that cell culture costs would be expensive, but if we are using very robust cell lines (e.g. MCF7), we can move this to a 96-well plate format. Last, we can use pipetting automation (e.g. Opentrons, if you're pressed for money) to delay treatment and collection times. A 96 point time series really should not cost more than $5000 assuming one lane sequencing on an Illumina NextSeq. So is it really expensive? I guess it's context dependent, but this seems reasonable.
For point number two, RNA-seq has traditionally been the workhorse assay for systems biology. Simply put, we extract RNA, covert to cDNA, and sequence. In this way however, gene activity is really more a function of steady-state levels of mRNA in a cell rather than the actual gene transcriptional activity. Methods like GRO-seq and more recent approaches like PRO-seq actually isolate RNA as it is being transcribed.
The analogy I like (courtesy of Robin Dowell) is to think of RNA-seq data as measuring the level of water in a bathtub and PRO-seq as measuring the flow of water from the faucet into the bathtub. The benefit with PRO-seq (and other nascent RNA sequencing methods) is that you can detect changes in transcriptional activity at very early time points before and after perturbation because you don't need to wait a significant amount of time for RNA to "build up" to measure a change in the bathtub's RNA.
For point number three, we really need to throw out the playbook on differential gene expression analysis all together. We've been using methods like DeSeq2 or EdgeR for almost a decade now. And these methods are great for the cases where you have one treatment and one control, but they are not necessarily designed to take into account the ordered, time dependent structure of time series data. Methods like delayed coordinate embedding can, in principle, disentangle causal structure from time series data alone. I also think some variant of a dynamic bayesian network (like a jacked-up HMM) would be appropriate here as we could more easily model error structure.
As a brief aside, causal network inference from gene expression time series data will suffer from the same problem that differential expression analysis suffers from today: how do you know that the predictions you are making are "right?" And for causal network inference, how do we test whether or not two genes are causally-related.
With enough time points, we might be able to assess whether gene A causes gene B. The idea of causality in signaling pathways is well beyond the scope of this blog post, however we might at the very least posit that there is some dependency on gene A from gene B from time series data.
In any case, if we are going to generate dense time points before and after perturbation, we are going to need to come up with new ways of analysis (see recent post by Ryan).
We'll publish (eventually)
You may or may not be wondering why Arpeggio is choosing to describe this work in a blog post and not a more traditional setting like a journal article. I can say few things to this: 1) we certainly believe in the rigor of a peer-reviewed journal and we plan to publish this (and other very very dense time series of drugs) and 2) because molecular biology doesn't normally perform such long and dense time series analyses, we are also hoping to spark a general discussion, sooner rather than later, on this topic.